TASKS AND RESPONSIBILITIES
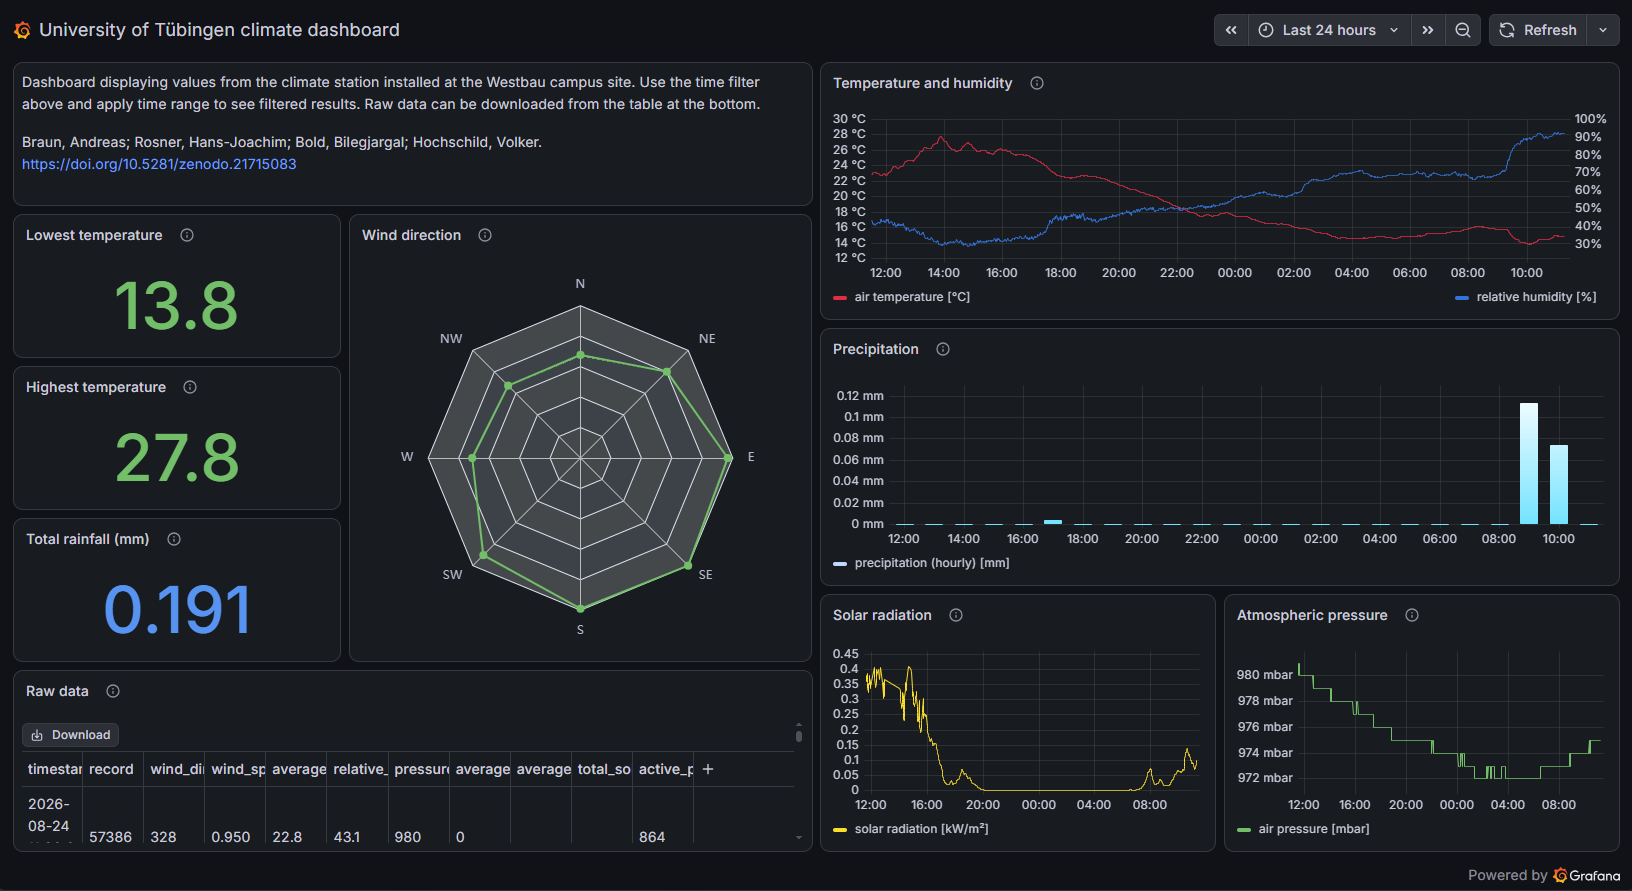
University of Tübingen climate dashboard
My tasks at the University of Tübingen largely concerned themselves with climate data and the various methods in geographic information systems (GIS) and remote sensing (RS) that could be used to support the analysis of land surface temperatures and urban heat dynamics.
To kick off the internship, my initial task was to visualize data from a climate station operated by the department that had its own logging software and periodically extracted this data into the university's internal system. At first, ArcGIS was proposed by the institution as the software of choice, yet its limitations, especially concerning visualization diversity, led to my proposing to use Grafana as the tool of choice best suited for such continuous, time-series data.
An ideal dashboarding environment usually consists of as few as possible links and workarounds between data sources and sinks, and is well-optimized. In this case, the climate station had its own proprietary software, and a direct connection to the station's data was limited through the software's commercial policy, hence a workaround needed to be utilized. The data was dumped periodically into a CSV file, which was not well suited for software like Grafana whose programming is optimized for SQL databases such as PostgreSQL or time-series databases like Prometheus. Thus a database server, the dashboard server and a fileshare, to which both the database and dashboard servers would have access to, were set up separately, with great help on the university infrastructure aspect from the institute's IT manager Christian Bick.
This work resulted in the creation & development of this dashboard, which was handed over to my supervisor, Andreas Braun.
The dashboard, its data and their accompanying information were given their DOI identifier, as the work of Andreas Braun, Bilegjargal Bold, Rosner Hans-Joachim and Volker Hochschild.
Analysis on Tübingen's surface features for identification of best contenders for field measurements of surface and air temperatures.
During the month of August, constellr, a satellite that measures land surface temperatures, was to pass over Tübingen collecting surface temperature data of 30 meters in resolution. This data was intended to be used for an analysis between the differences between surface and air temperatures at urban surfaces of different types (e.g., vegetated suburbs, vegetated high-rise, non-vegetated urban), whereby the relationship has been established to be different across surface types. The goal was thus to identify 5 different classes of surface types in Tübingen to get the best possible distribution of sampling points where in-situ measurements were to be collected.
A challenge was that the grid of constellr is unknown, hence it posed the risk of a pixel being overrepresented if two sampling points were too close (or the other way around, if a sampling point didn't coincide with an important pixel at all). Therefore, an arbitrary grid of a resolution of 90 meters was created, assuming there is a 100% probability that any pixel would fall within this grid, to analyze the physical features within.
The physical features consisted of building heights, building coverage, vegetation heights and vegetation coverage, all of which were openly available thanks to the LGL platform offered by the government of Baden-Württemberg. The result of this was, as per the goal, the identification of homogeneous areas in Tübingen to spread the sampling points as meaningfully and as most representatively of the area as possible.
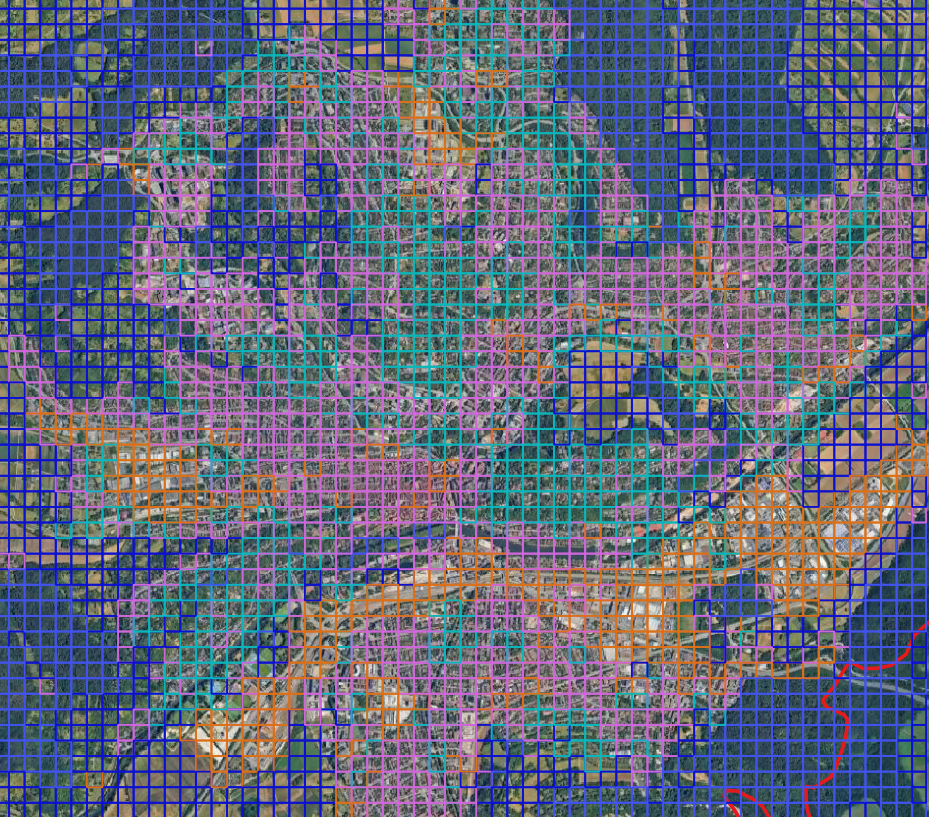
These sampling areas were then used as indications for where to collect temperature data, and field measurements were made (which I had the opportunity to take part in). Using an IR sensor pointed at the ground and an air temperature sensor, a team of 10 were spread out across the city to collect surface and air temperature data, which they would then submit through the app ODK Collect (a nice, free alternative to ArcGIS Field Maps).
Due to unfitting, cloudy weather conditions, the satellite data could not be collected at the time of field measurements. It was, however, a learning experience to me in that it's a rather niche GIS workflow that nevertheless applies to many different fields that have surface properties as a parameter in their analyses.
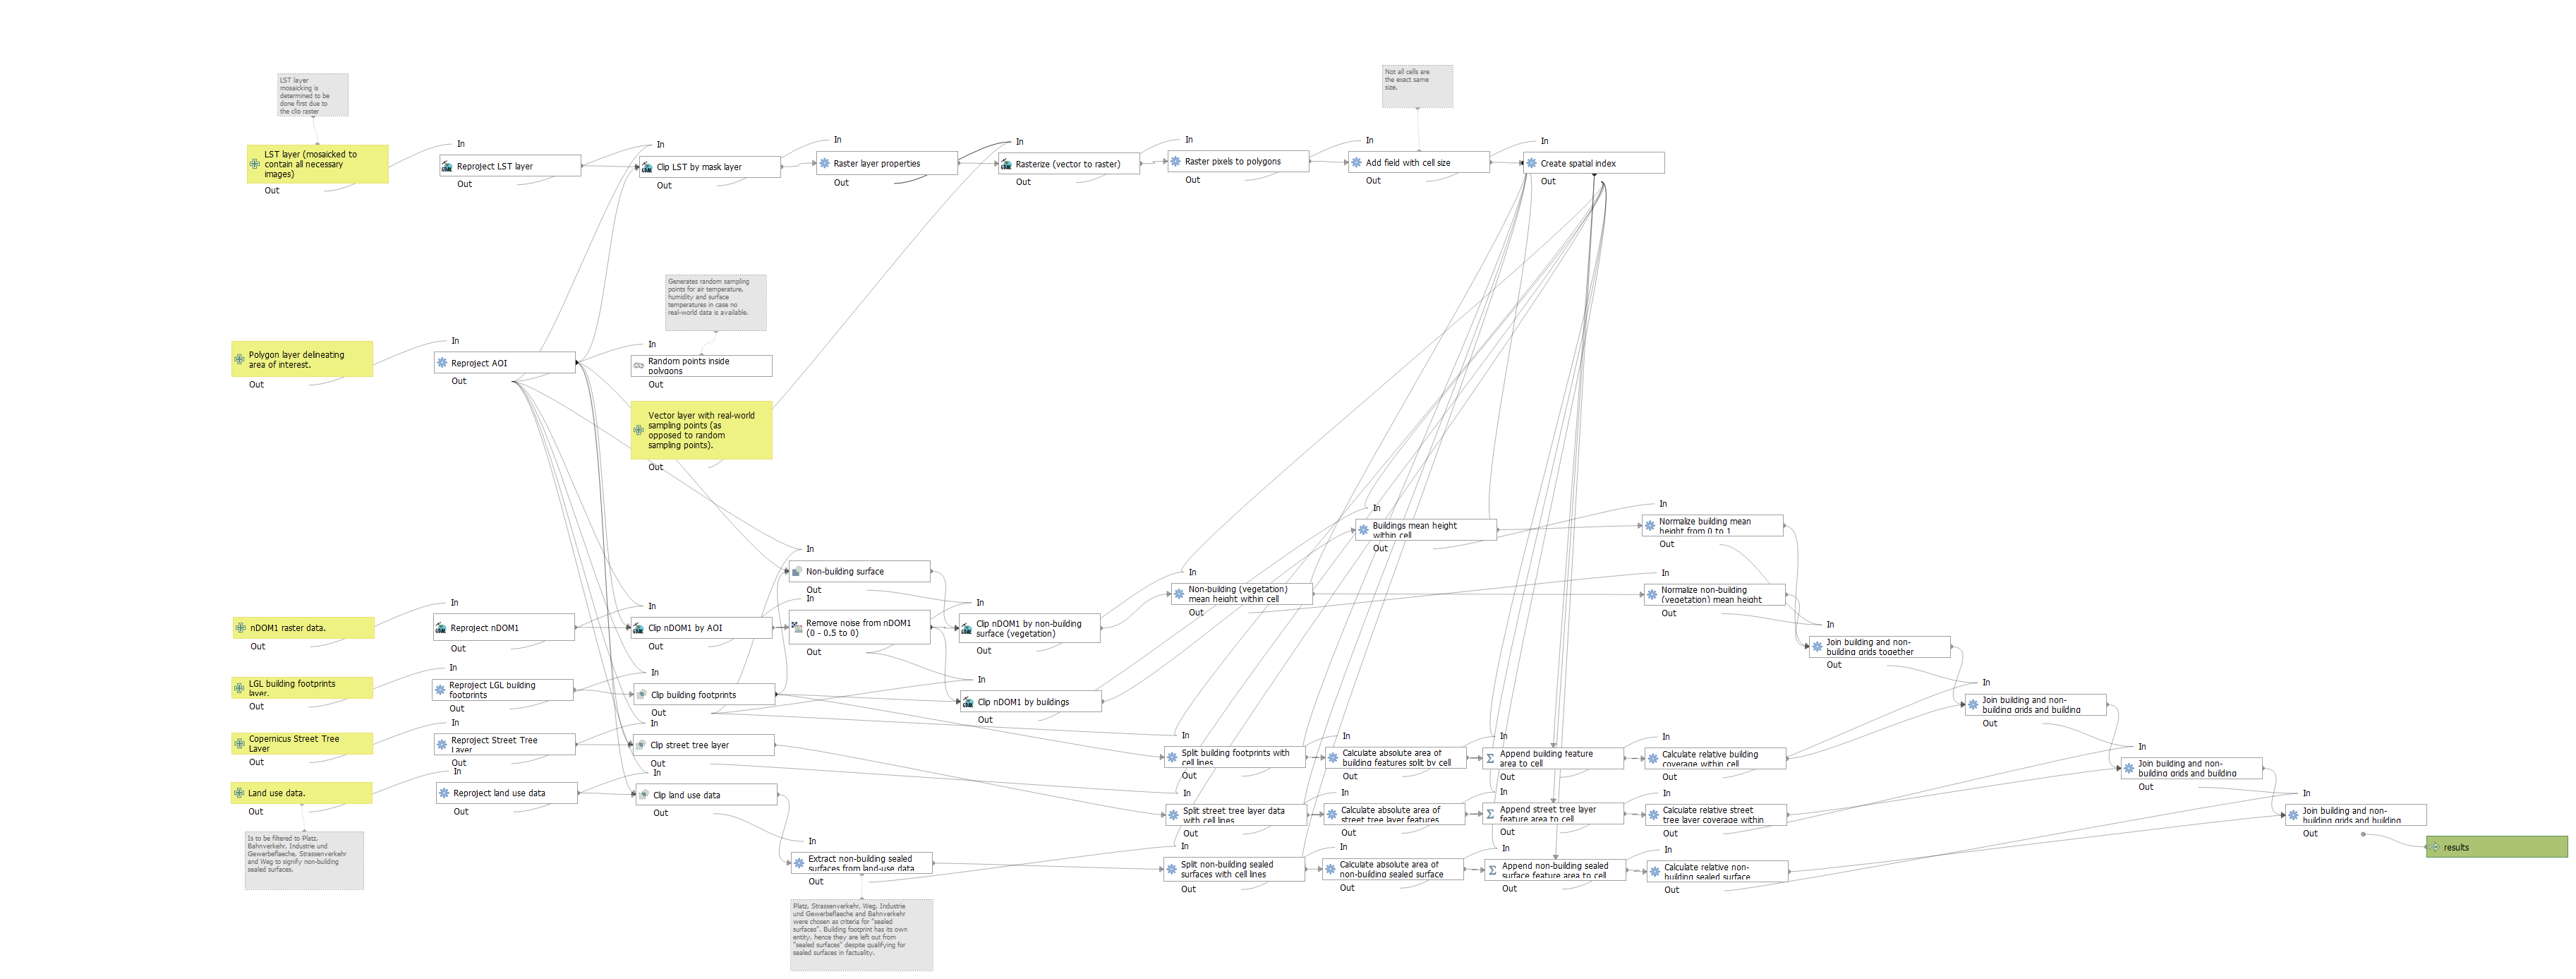
A reverse of the above approach: a programmed model to consolidate sampled points, LST data and surface properties for further analysis.
For the LST analysis, the work needed to process, consolidate and standardize data was admittedly time-consuming. Hence, a QGIS Model Designer model was created that standardizes all data (LST, surface properties and such) that completes the above processing workflow with a small yet meaningful difference: it would consolidate, alongside the GIS data, the data from the sampled points to prepare it for correlation analysis between real-world and LST temperature data. If the previous task was to identify best contenders for sampling points, this one, in contrast, was with the assumption that the field data was to be already collected, with only the "joining" of the LST data to it remaining as the final step in analysis.
REFLECTIONS
Looking back on the internship, I could confidently say that it was an internship perfectly suited for me, as my idea was to get the best possible understanding of working in academia in Germany, and to get as much experience as possible in as many fields as possible, which the various "mixed-bag" research activities made possible without doubt. The identification of homogeneously structured areas in Tübingen was the most interesting part for me, and I could see it being used not just for LST analytics, but rather a wide variety of fields that use GIS.
It should not go unmentioned that the University of Tübingen is full of exceedingly supportive and helpful people.
CHALLENGES
No drastic challenge was faced during the internship. Everything went smoothly thanks to a capable faculty at the university.
SUGGESTIONS
As a general rule, I found that one need not shy away from what they really want to do at an internship, especially in academia, be it menial work, research, or automation; they usually have all sorts of work lying around that can be revived, enhanced and developed, and thus I think it's important not to underestimate the variety of work that can be undertaken at any given institution.